
Apple CEO Tim Cook at WWDC 2018
Revenue and Net Profit
Apple set a new revenue record in its Q1 2020 results, generating $91.8 billion in the period. This equates to approximately 8.9% up from the $84.3 billion earned in Q1 2019, and is even higher than Apple’s own guidance range, which topped out at $89.5 billion.
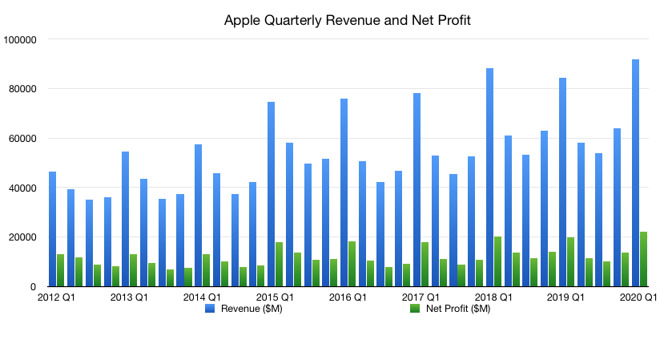


Net profit reached $22.2 billion for the quarter, up from the $19.96 billion one year prior. This represents a percentage increase of 11.4% year-on-year, higher than the overall revenue gain.
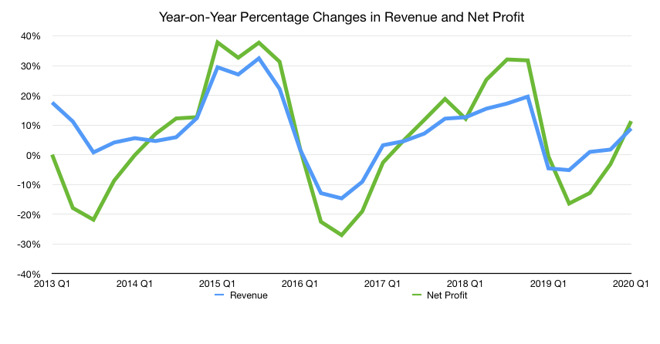


The improvements for both revenue and net profit are a remarkable turnaround from last year, where each shrank 4.5% and 0.5% respectively. The reductions continued into the second quarter, at 5.1% down and 16.4% down year-on-year for each, though it is probable Q2 2020 will again fare better than the previous year.
Gross Margin
The gross profit for the quarter was $35.2 billion, which works out to be approximately 38.35% of the overall revenue total. The percentage is in line with typical historical results for the company, and is slightly higher than 37.99% recorded one year ago.
As the amount of gross profit generated typically varies along the same lines as the main revenue figure, the gross margin percentage hovers in the range of 37.5% and 40%, albeit occasionally straying above and below in previous years.
Products
As it has been for many years, Apple’s main moneymaker is the iPhone, with other products making up the remainder. Aside from showing how much of an impact iPhone makes on the balance sheet, the chart also shows how Apple’s Services business is steadily growing, seemingly unaffected by seasonality.
In terms of year-on-year percentage changes, iPhone is shown to have returned to growth, with Services and the Wearables, Home, and Accessories sections also assisting, while Mac stayed flat and iPad was a little down.
iPhone
For iPhone specifically, Apple reported $56.0 billion in revenue, which is up from the $52 billion it brought in last year. The quarter is also the first to have the current-generation iPhones to be sold throughout the period, with the popularity of the iPhone 11, iPhone 11 Pro, and iPhone 11 Pro Max certainly being demonstrated.
Of the trio, the iPhone 11 was Apple’s best-selling iPhone model during the quarter.
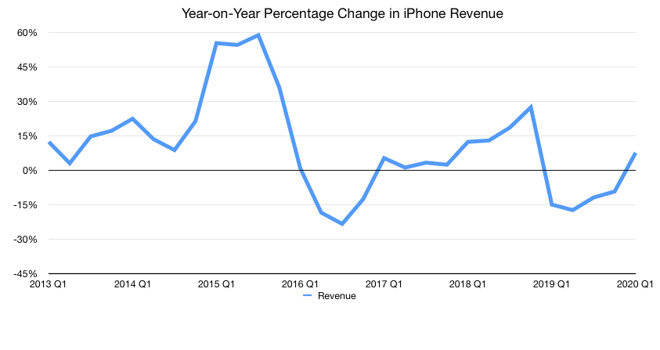


On a year-on-year basis, iPhone is up 7.6%, and counters a series of declines. From Q1 2019 to Q4 2019, iPhone’s YoY revenue went down 14.9%, 17.3%, 11.8%, and 9.2% respectively.
iPad
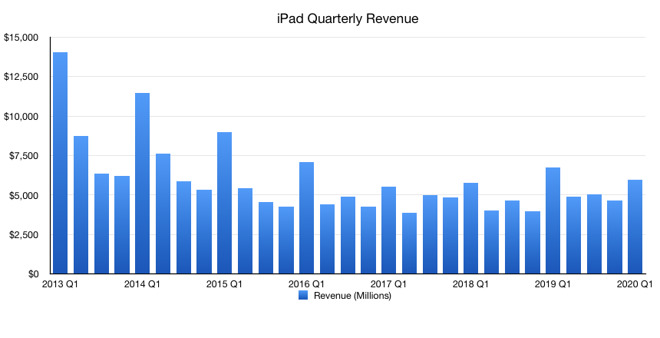


The iPad hauled in $6 billion in revenue for the quarter according to Apple, though the results actually state it is $5.957 billion to be more precise. This represents a decline of 11.2% year-on-year from the $6.7 billion recorded last year.
Mac
Apple released the 16-inch MacBook Pro and Mac Pro during the 2019 holiday quarter. The new MacBook Pro was available for about half of the quarter, and the Mac Pro shipped for just three weeks.
In 2018, Apple updated the Mac mini, and MacBook Air for the holiday quarter. Both the Mac mini and MacBook Air are far more suitable for a holiday gift-giving season. Despite the tough compare, Mac revenue was remarkably similar year-over-year.
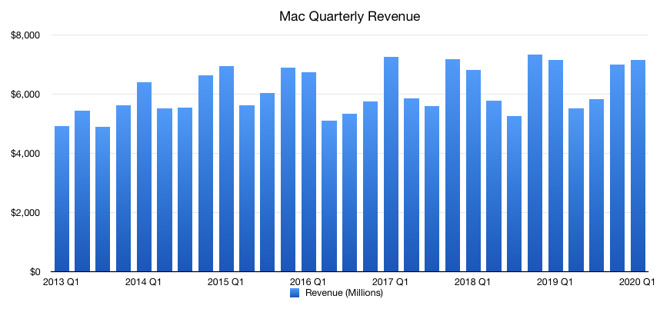


Apple’s Mac earnings for the quarter were extremely close to last year’s period, far closer than the $7.2 billion for Q1 2020 and $7.1 billion for Q1 2019 indicates.
Examining the numbers with more decimal places, Apple earned $7.160 billion in Q1 2020 and $7.146 billion for Q1 2019. The difference is just $14 million, and results in a year-on-year change of a mere 0.2%.
Wearables, Home, and Accessories
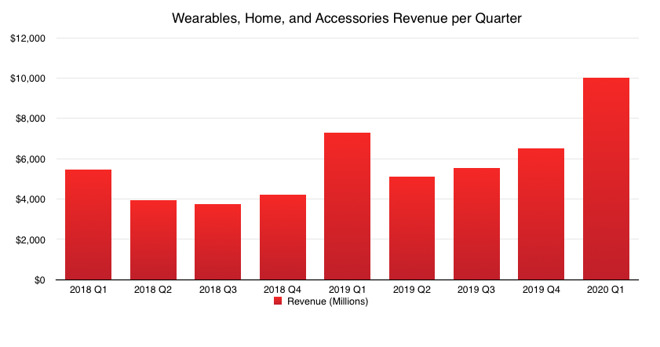


The relatively new kid of the group, the Wearables, Home, and Accessories arm reported $10.01 billion in revenue in Q1 2020. Of Apple’s five units it recognizes, the arm is now in third place with higher sales of both the iPad and Mac sections, and is effectively the size of a Fortune 150 company.
The segment benefited from being the first full quarter for sales of the Apple Watch Series 5, while the launch of the AirPods Pro is likely to have helped. The fact that Apple’s products under the category can be provided as gifts certainly helped during what is effectively the holiday quarter.
As it has done over the four quarters previously, the arm records the highest year-on-year revenue change of all five sections. While not as high as the 54.4% recorded for Q4 2019, the 37% for Q1 2020 is still extremely respectable for the arm, and is more than double the YoY growth shown by the highly-regular Services.
Services
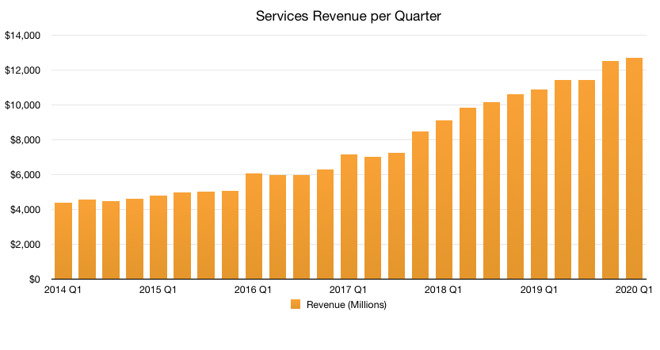


With the launch and growth of subscriptions for Apple TV+, Apple Arcade, and others, Services is continuing to be an extremely reliable part of the Apple empire. For the period, Apple reports revenue of $12.7 billion, a new record for the business.
During the conference call, new records were declared for elements within Services, including cloud services, music, payment services, and the App Store search ad business. A December quarter record was also seen for the App Store and AppleCare, as well as double-digit growth in all five geographic segments.
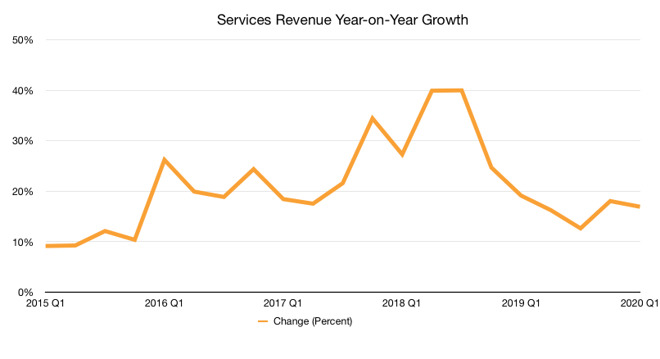


The almost supernatural growth of Services has continued, with its 16.9% year-on-year improvement showing it is still providing steady progress for the company. It may not be in the 30s as seen during 2018, but the growth isn’t something that can be ignored.
Unlike iPhone and other product-based units, Services deals a lot with ongoing subscriptions and regular App Store purchases, rather than hardware sales. This makes it far more resilient to seasonality, as demonstrated by the iPhone revenue chart, with its growth more able to carry into the next quarter’s results, making any growth highly beneficial.
Regional Revenue
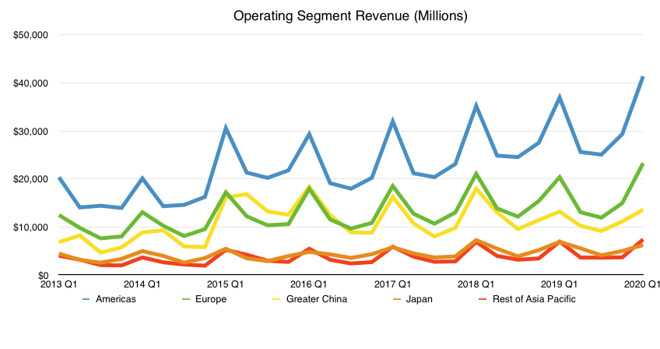


In terms of where Apple earns its revenue, the Americas continues to be its biggest market, hauling in $41 billion, followed by Europe with $23 billion then Greater China at $13.6 billion, and Japan’s $6.2 billion is beaten by the Rest of Asia Pacific’s $7.4 billion.
On year-on-year changes, Europe saw the greatest increase of 14.3%, with the Americas at 12%, China at 3.1%, and Rest of Asia Pacific at 6.5%. Japan was the only one to contract YoY, by 9.9%. The growth is also a reversal of reductions observed in Europe, Greater China, and Japan, in both the year-ago Q1 2019 and sequential Q4 2019 quarters.
The quarter is Apple’s 13th quarter in a row where it saw YoY growth for the Americas.
China
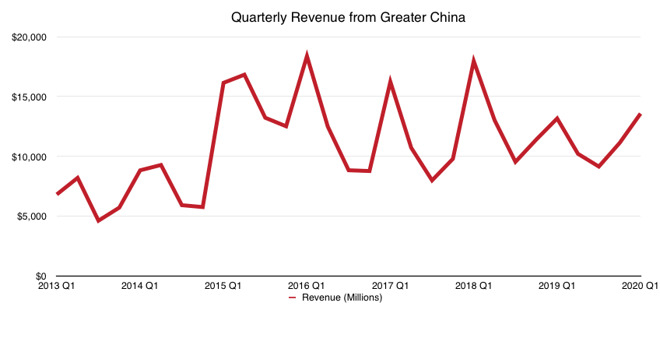


Apples push for sales in China has borne fruit, with $13.58 billion in revenue for the quarter. According to Apple CEO Tim Cook, Apple saw double-digit iPhone growth within mainland China, with iPhone holding three of the top four spots for best-selling phones in the region.
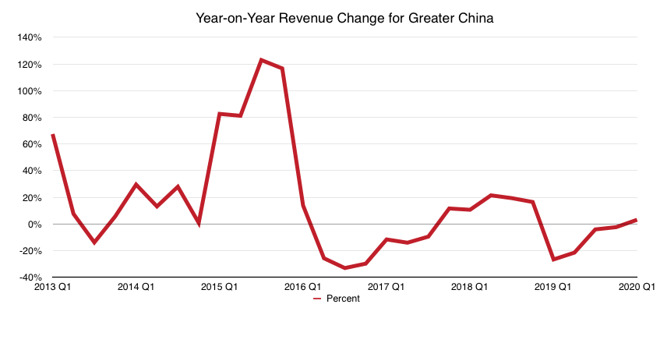


While the improvement in China is relatively low at 3.1%, the fact that it is growth is a good thing for Apple as it saw year-on-year contraction for the last four quarters. Most of the damage to revenue was done in Q1 and Q2 2019 at -26.7% and -21.5% year-on-year changes respectively.
It may be growth, but there’s still a fair way to go for Apple to reverse the effects on revenue of those two quarters in particular.